Script Call Chain Visualization
Overview
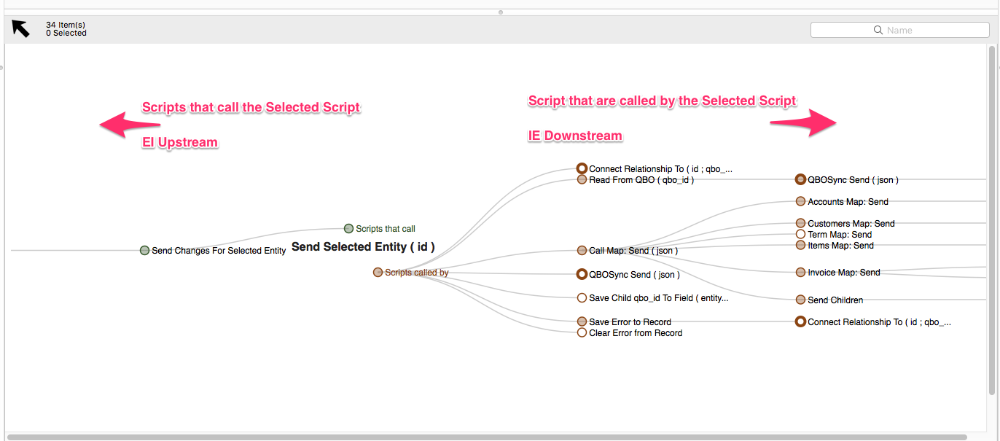
Call Chain Visualization provides you an interactive view of the entire script call chain, the scripts it calls, and those that call it, as far as we can reach.
Navigating to the Diagram
You can reach this visualization by navigating to the script you want to visualize and selecting "Call Chain Diagram".
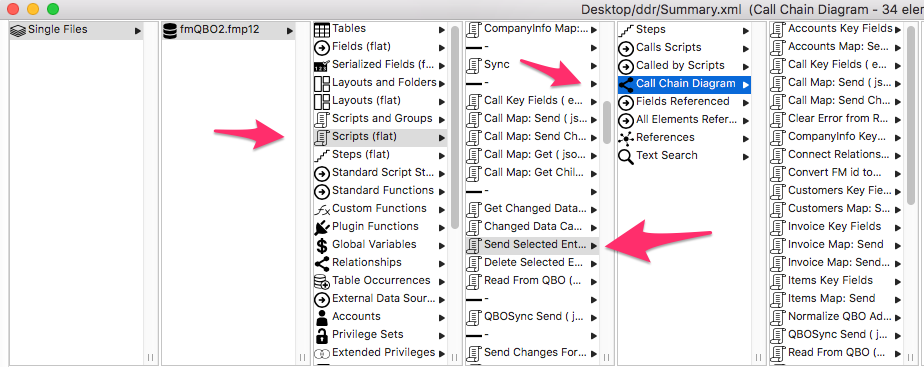
After selecting Call Chain Diagram you should see something like this.
Working with the Diagram
- Click-and-drag to reposition the chart in the window.
- Scroll/pinch to zoom in and out
- Click on a shaded dot to collapse/expand the child nodes
- Click on the name of a script to drill down into that script in the FMPerception hierarchy. You can drill back up the hierarchy to return to the chart.
- Mouse over a script to see the full name, source file, and the number of times it appears on this chart.
- Scripts that appear more than once will be displayed with a thicker circle, and if you mouse over one of these scripts, every occurrence of that script on the diagram will light up.
- A star will appear next to scripts that run with full access privileges.
- A folder will appear next to scripts that exist in a different file from the file containing the original script.
Other Notes
Because of the possibility of scripts calling themselves, or calling another script that calls the original script, we can't always display all of a script's children, every time it appears on the diagram. So, if a script appears on the diagram more than once, one of those dots will display all of its children. Scripts that appear more than once will be displayed with a thicker circle, and if you mouse over one of these scripts, every occurrence of that script on the diagram will light up. Check it out. It makes it pretty easy to follow the thread of a looping/recursive script sequence without filling the screen with many copies of the same tree.